Appearance
Module 6 · Measure what matters
Leer en español: Módulo 6 · Mide lo que importa.
Goal: read penetration analytics like an owner: per person, not per call — and tell connecting apart from real contact. Time: ~7 minutes · Before: Module 5.
1. The classic mistake: measuring calls
"Today we made 4,000 calls and connected 900" sounds productive and says nothing: they can be 900 connections with the same 150 easy-to-reach people, while 70% of the portfolio stays untouched. The client who handed you the portfolio does not care how much you dialed — they care how many of their accounts you reached.
That is why analytics here deduplicate per person: each account counts only once, no matter how many attempts it received.
2. The penetration funnel
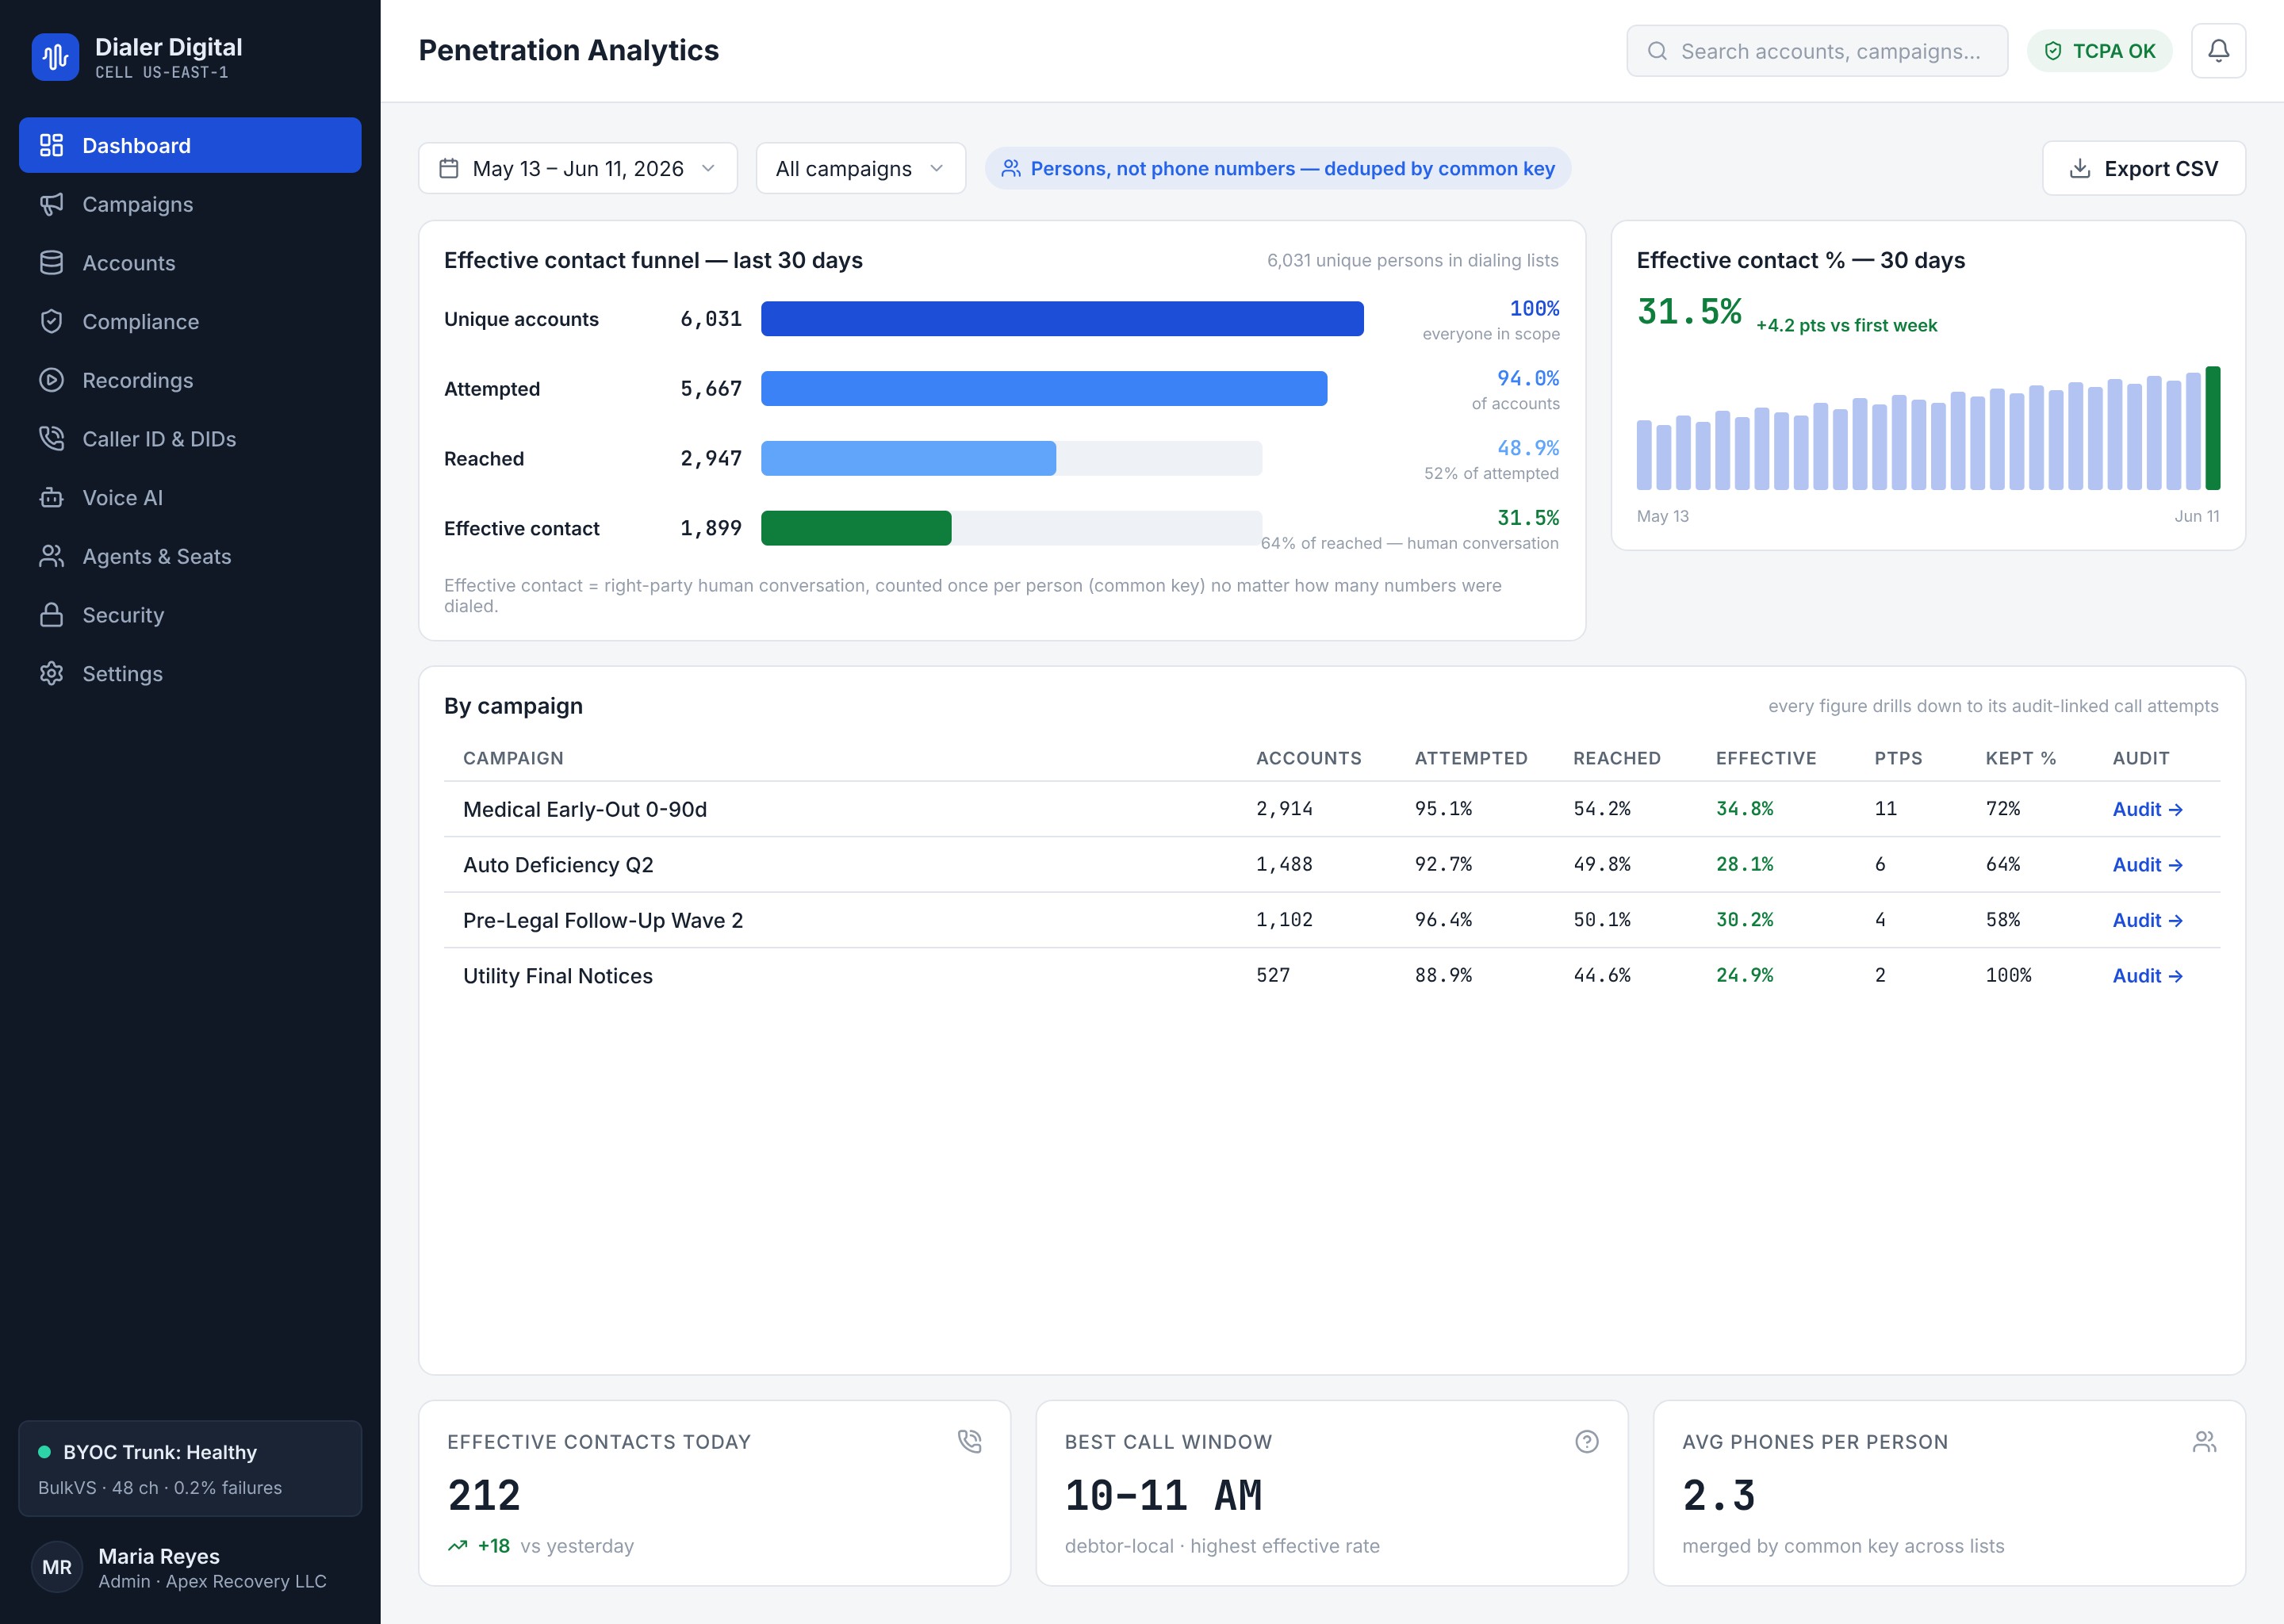
In Analytics, the funnel goes down four steps:
| Step | Means | Question it answers |
|---|---|---|
| Unique accounts | The whole portfolio in the range. | How much was I handed? |
| Attempted | Accounts with at least one attempt. | How much have I worked? |
| Reached | Accounts where something happened (any non-failed outcome). | How much am I reaching? |
| Right-party contact | Accounts where a human answered or there was a conversation. | How many am I really talking to? |
The gap between steps is your diagnosis:
- Unique → attempted drops: unworked portfolio (paused campaign? blocks because of incomplete data? — review Module 4).
- Attempted → reached drops: bad phones. Go back to the E.164 report and the
exceptions.csvfrom Module 2. - Reached → right-party drops: you get through, but no human answers — a problem of hours or burned numbers, not of volume.
3. Connect rate vs. right-party contact
They are two different metrics and you need them together:
- Connect rate (dashboard): of today's calls, what fraction connected. It measures the operational health of the day (trunks, caller IDs, pacing).
- Right-party contact (analytics): of the people in the portfolio, what fraction you have talked to. It measures real progress on the portfolio.
A high connect rate with stalled right-party contact = you are reconnecting with the same people. The answer is not to dial harder: it is a well-filtered rewind or better data for the rest of the portfolio.
4. Per campaign, with the audit one click away
The campaign filter at the top of Analytics is a searchable picker; it hides archived and completed campaigns until you tick Include inactive and archived (how the pickers work). The same goes for the campaign filter of the call record (Call attempts) that the links below open.
The per-campaign table splits the same funnel. Each row carries links that take you to the call record already filtered to that campaign: from the aggregate percentage to the call-by-call detail — with its evidence — without building the filter by hand. That is the monthly report for your client: 84% penetration, 31% right-party contact, and here is the backing, auditable.
The same table carries, per campaign, the two promise columns:
- Open PTPs — how many open promises to pay were captured on that campaign's calls. A campaign with no promises shows a real zero.
- Kept % · client-reported — kept ÷ (kept + broken), over promises dated in the last 30 days. The cell carries its denominator (e.g.
75% (3/4)), and if no promise was resolved in 30 days it shows—, never 0 %: there is nothing to measure yet.
Promises captured outside a campaign call are not lost: a note under the table counts them separately.
Why the header says "client-reported"
The platform cannot tell on its own whether the consumer paid. A promise becomes kept or broken when someone marks it: from the promises tab (Module 5) or from your collections system, through PATCH /v1/promises/:id. The rate is only as good as that discipline: if nobody marks the promises, the column stays at —. That is why the header says so instead of passing it off as a figure the dialer measures on its own.
5. Close the loop: the promises
The last metric that matters: of the PTPs you captured (Module 5), how many were kept.
- Open amount per currency (USD and MXN are never added together — they are currencies, not points).
- 30-day kept rate: of the promises that came due and that you resolved in the last 30 days, the
keptfraction. If it is empty, it is not zero — it means nobody has resolved promises: a pipeline discipline problem, not a dialing one.
Best call window and phones per person
The Best call window and Avg phones per person KPIs are now live — they are explained in the next section.
6. Day by day: the per-day breakdown
In Analytics, the Effective contact by day panel splits penetration by day and by campaign. Each row is one day and one campaign, with four columns: Attempted, Reached, Effective and Effective % (persons with an effective contact that day ÷ the campaign's accounts).
- Which time zone the days are cut in. A "day" depends on the time zone: the same 11:30 pm call in Mexico City already belongs to the next day in UTC. That is why the panel never cuts days in an implicit zone: by default it uses your browser's, and the selector also offers UTC and the default time zone of each of your campaigns. Under the selector it always says so: "Days are cut at midnight in …". When you compare against your client's report, pick the same zone they use.
- How many days. The breakdown covers up to 31 days: it shows with Last 7 days or Last 30 days. With Last 90 days or All time it is not requested and the panel explains why; the funnel and the per-campaign table keep covering the whole range.
- A day's counts do not add up across days. They are person-level counts per day: a person reached on two days counts on both. Across campaigns on the same day they do add up. The first and last day are partial when the range does not start or end at midnight.
- A failure is shown as a failure. If the time zone is not accepted, if the query fails or if the server returns no breakdown, the panel says so with its own message; it never paints it as an empty table.
7. The best call window and the phones per person
Two Analytics KPIs tell you when your portfolio answers and how many phones you hold per person:
- Best call window. The two consecutive hours with the highest contact rate, counted in the consumer's local time (not yours). The panel shows the window (e.g.
17:00–19:00) with its rate and its number of attempts. If no pair of consecutive hours reaches the minimum of attempts, it does not invent an hour: it says "Not enough data yet" with its reason. It covers at most 90 days. - Avg phones per person. How many distinct phones there are, on average, per
consumer_refacross your tenant's open accounts. If there are no people with an open account, it says so; it does not draw an invented zero.
Both read from their own endpoint, /v1/stats/contact-windows, and only see your tenant's data. The window is shown in the consumer's local time and the panel says so, so you do not confuse it with your own clock.
Test yourself
- A person with one account received 6 attempts this week. How many times do they count in "attempted"?
- Connect rate 38% (excellent) but right-party contact 12% and flat. What is happening and what do you do?
- Why does the open amount of promises not show a single total?
- In the per-day breakdown, a campaign shows 40 effective on Monday and 35 on Tuesday. Is that 75 persons reached?
Answers
- Once. Penetration deduplicates per person/account; the 6 attempts are detail of the record, not of the funnel.
- You are reconnecting with the same people. Time for a rewind with good filters and/or better phones for the rest of the portfolio — not more volume.
- Because there are promises in USD and in MXN, and different currencies are not added together. Each currency reports its own amount.
- Not necessarily. They are person-level counts per day: someone reached on both days counts on both. The unique persons of the range are in the funnel and the per-campaign table.
🎓 You finished the path
You now have the full cycle: sign in (1) → load the portfolio (2) → a campaign with the hard-wired 3% (3) → compliance that blocks and leaves evidence (4) → run the day with real PTPs (5) → measure per person (6).
Are you going to integrate the system with your CMS or your warehouse? Continue in Developers.